
 The RAC Foundation has brought together some interesting facts and figures in relation to motor vehicles here in the UK. We thought we would share some of them with you but more can be found on their website.
How many motor vehicles are located in Great Britain?
There were 37.9 million motor vehicles licensed as at the 31st March 2018 with 31.3 million being cars. Almost every year since the Second World War ended the number of motor vehicles has risen. The average annual increase since 2012 has been 640,000.
There were 2,540,617 new cars registered in the UK in 2017.
In 2017, there were 8,113,020 used cars that changed ownership.
There were 1,671,166 new cars built here in the UK in 2017.
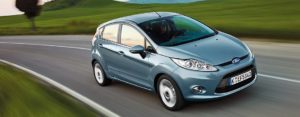
What make and model of car is the most popular?
It is the Ford Fiesta with 1.5 million being licensed as at the 31st December 2017, with the Ford Focus in second place at 1.3 million and the Vauxhall Corsa in third place on 1.1 million.
How many driving licenses are there?
There were 48,416,500 driving licenses registered with the DVLA in March 2018. Full driving licenses make up 40,331,643 and provisional driving licenses account for 8,084,857. It should be noted that these figures include licenses for people who have for instance died or emigrated and the DVLA have not been informed.
A more accurate estimate of active holders of driving licenses is produced by the National Traffic Survey with an estimated 32.9 million people in England being in possession of a full car driving license. Men make up 17.3 million and women 15.6 million.
How many English households have access to a car or van?
In the region of 76% in 2017 with this figure having increased substantially over the years – in 1971, the figure was 52%. Between 1971 and 2017, the percentage of households with two or more cars and/or vans rose from 8% to 35%.
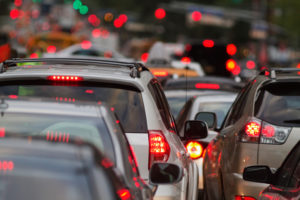
What is the average speed a vehicle travels at?
The figures that stand out for 2016 are that, within a 20 mph speed limit area, all vehicles drove, on average, above the speed limit – cars and vans drove at an average free flow speed of 25 mph. In a 30 mph speed limit zone, cars and vans drove at an average free flow speed of 31 mph. It is rather concerning that the speed limits have been broken so frequently. The average free flow speed for cars and vans on single carriageways with the national speed limit was 49 mph and the average free flow speed on motorways was 68 mph for cars and 69 mph for vans.
How often do we drive our cars?
You may be surprised to read that the average time we spend driving our cars is a mere 4%. Our cars are parked at home for 80% of the time and are parked at other locations for 16% of the time.
What is the average annual mileage for every car in England?
In 2017, it was 7,800 with this being a drop when compared with 2002 when it was 9,200. Diesel cars averaged 10,100 miles per annum and petrol cars averaged 6,500 miles per annum.
It is estimated that motor vehicles in Great Britain drove 327.1 billion miles on our 246,700 miles of roads in 2017. In 1949, the figure was 28.9 billion.
There were at least 31,483 claims made to councils for damage to vehicles caused by potholes in 2015/16 in Great Britain with the average settlement figure being £306.
We trust that you found the above statistics to be of interest and no doubt some of them were rather surprising to read about.

You must be logged in to post a comment.